
The global OTT video market is set to grow to US$443.29bn by 2029. That’s a massive opportunity for video creators and subscription platforms in the years ahead. And we’re already seeing creators capitalize on this market boom.
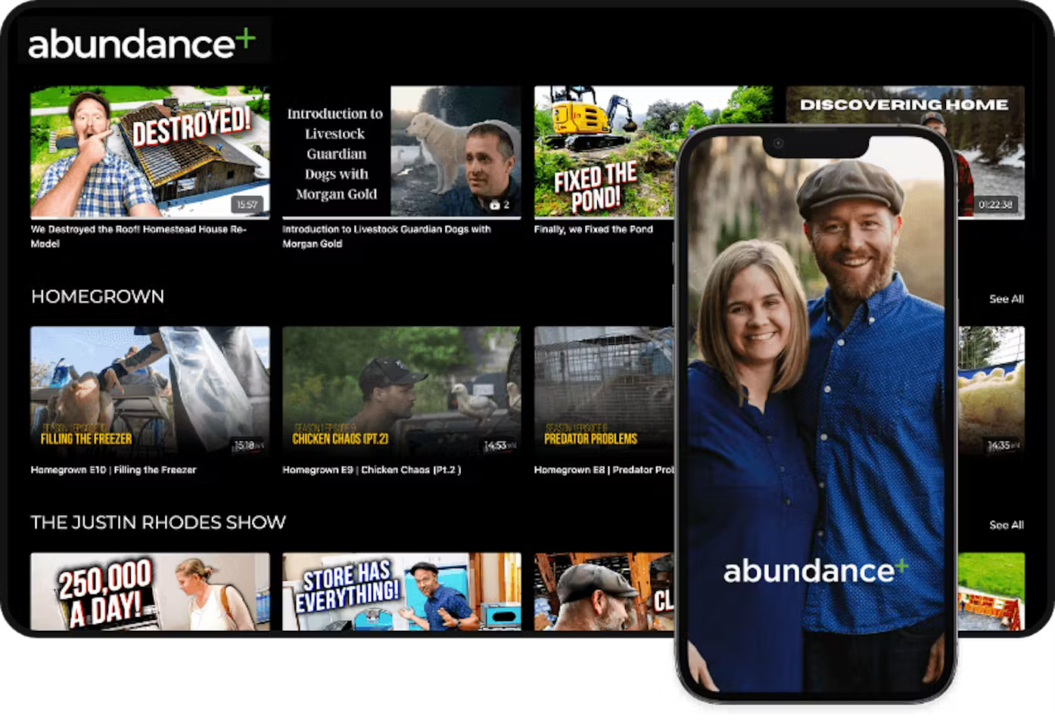
For example, Abundance+, a niche homesteading platform, launched 6 mobile and TV apps and scaled to over 7,700 paying subscribers. Today, with more than $1m in annual revenue and 76% of viewership coming through apps, it’s a prime example of how mobile-first strategies drive meaningful business results.
If you’re a little cautious about starting your subscription or membership site, this collection of 134 statistics should help ease your decision-making process.
You’ll find insightful supporting data for building your business, gathered from Uscreen’s customer base and reputable external sources.
Subscription statistics on OTT industry growth & engagement
Consumer appetite for on-demand video has exploded, with streaming now a daily habit for most Americans. Mobile and TV apps are dramatically changing how and where people consume content. Expect to see how accessibility influences commitment and platform success.
- The OTT industry is experiencing explosive growth, with projected global revenues reaching $443.29bn by 2029. (Statista)
- In the U.S. alone, OTT revenue is set to climb to $146.25bn in 2025, reinforcing its dominance in the entertainment economy. (Statista)
- Platforms that offer mobile and TV apps see 121% more annual plan purchases than those that don’t, a clear signal that accessibility boosts commitment. (Uscreen)
- A staggering 99% of U.S. consumers subscribe to at least one streaming service, making subscriptions nearly universal. (Forbes)
- On average, Americans maintain 2.9 subscription services at a time—a number that reflects growing demand for diverse and niche content. (Forbes)
- Americans now spend an average of 21 hours per week streaming content—equivalent to a part-time job—indicating just how central digital video has become to modern life. (Forbes)
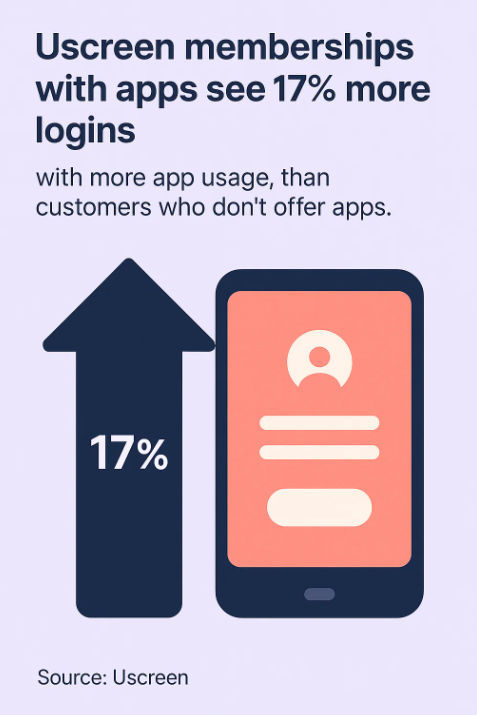
- Uscreen creators who offer mobile apps see 17% more user logins compared to those who rely on web-only platforms—proof that apps keep audiences engaged. (Uscreen)
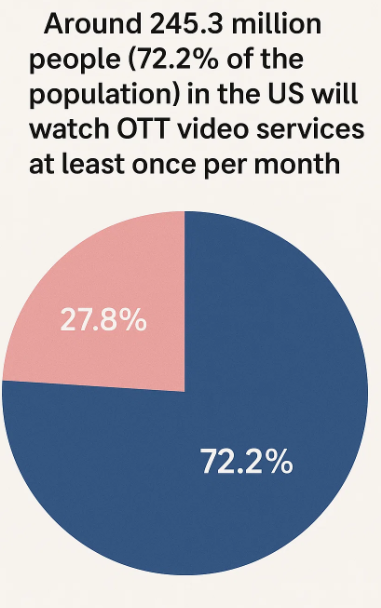
- Around 245.3m people (72.2% of the population) in the US will watch OTT video services at least once per month. (Insider Intelligence)
Takeaway: The OTT space is undergoing a mobile-first transformation, and creators who prioritize app accessibility are winning more loyal and active audiences.
The global VOD subscription market at a glance
The subscription video-on-demand (SVOD) market stands out as the most lucrative part of the OTT industry. Global smartphone adoption is accelerating mobile streaming habits, making SVOD a high-ARPU opportunity. The global market indicators point toward rapid, sustained growth.
- Revenue in the subscription video-on-demand (SVOD) market is projected to hit $119.09bn globally by 2025—a clear signal of the market’s growing dominance within the OTT ecosystem (Statista)
- Average revenue per user (ARPU) in the SVOD market worldwide is expected to reach $78.97 in 2025, showcasing the monetization strength of these platforms. (Statista)
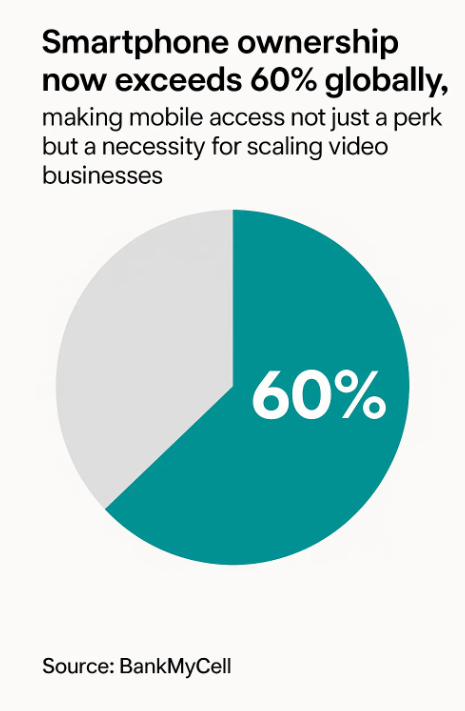
- There are over 7.21bn smartphones worldwide capable of running video apps, with more than 60.42% of the global population owning one—a fundamental driver of mobile OTT consumption. (Bank My Cell)
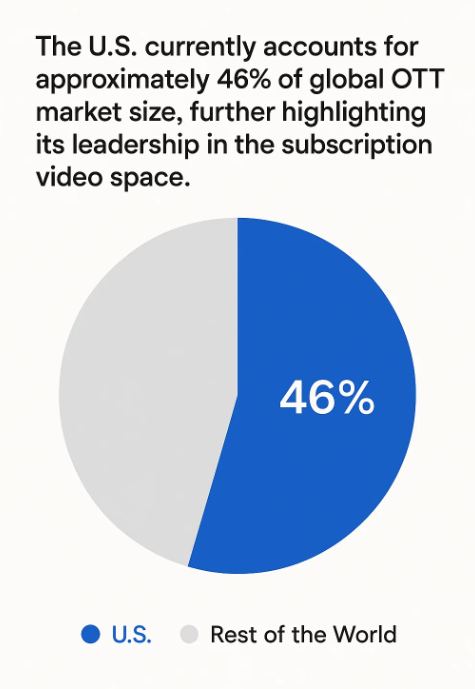
- The U.S. currently accounts for approximately 46% of global OTT market size, further highlighting its leadership in the subscription video space. (Global Logic)
- OTT user penetration worldwide is forecasted to reach 70.1% by 2029, marking an all-time high and a strong sign of continued global demand. (Statista)
- India’s OTT video users are projected to grow to 4.2bn by 2027, making it one of the fastest-growing markets globally. (Times of India)
- Cable TV continues to decline, with U.S. subscriptions dropping by 34.57% since 2010—proof that consumers are ditching traditional viewing models in favor of on-demand services. (Evoca TV)
Takeaway: SVOD is driving the global OTT economy forward, with mobile access pushing adoption and revenue potential to new heights.
Subscriber growth & market share by platform
Subscriber growth is heavily influenced by the platform’s ability to meet consumers where they are—on every device. From Netflix to niche platforms, those investing in mobile and TV apps are seeing major gains. This data showcases the link between device strategy and market leadership.
- Netflix continues to dominate the SVOD landscape in North America, with 81.44m users and a 21% share of the U.S. market. (DemandSage)
- Netflix also captures 31% of all subscription revenues across the U.S. and Canada, showing its unmatched ability to monetize subscribers. (Forbes)
- Creator platforms with apps saw a 17% year-over-year growth in 2024—over four times the 3.6% growth of those without apps. That’s a 121% performance advantage, highlighting how mobile access significantly boosts platform momentum (Uscreen).
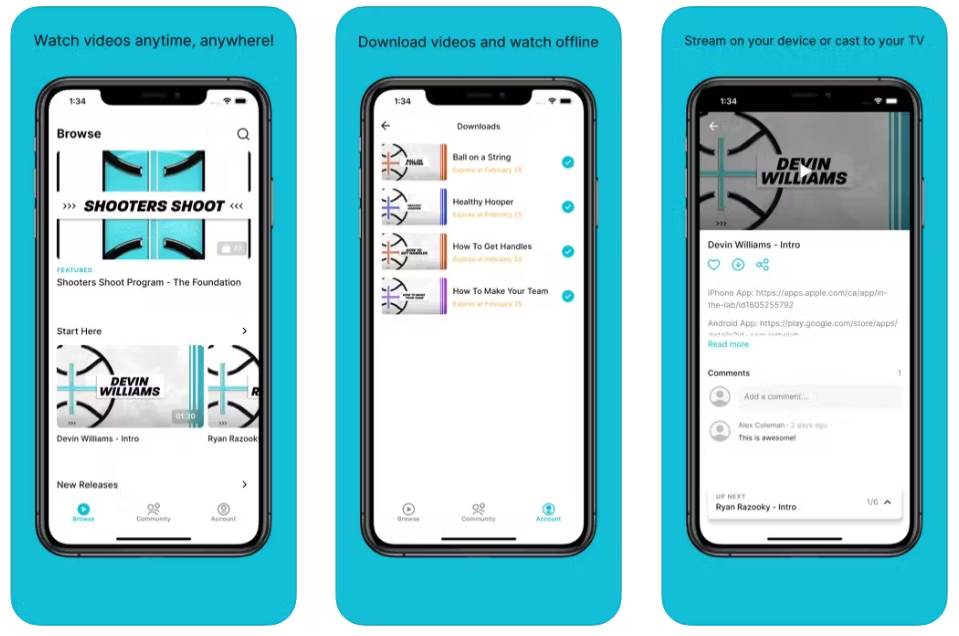
Creator Spotlight: How In the Lab+ doubles in viewership after migrating to Uscreen
In the Lab+, a basketball-focused brand, doubled its total viewership after launching two mobile apps, with 79% of their total views now coming through OTT apps. See how Lab+ turned a viral moment into a global business.
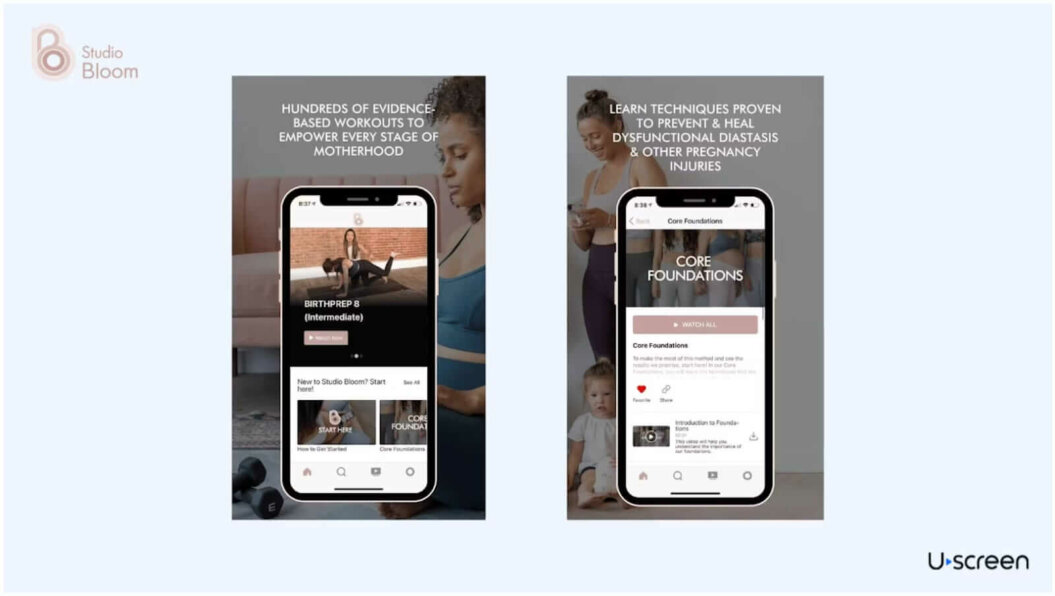
Creator Spotlight: Studio Bloom scaled to $1M+ annual revenue by transforming its tech stack
Studio Bloom, focused on prenatal fitness, grew to over 5,000 paying members and earned over $1M in annual revenue, with 76% of viewing coming through mobile and TV apps (Source: Uscreen).
Learn how Studio Bloom made a switch to their tech stack and transformed its business.
Creator Spotlight: How Abundance+ created a Netflix-style membership community and 2X’ed their revenue
Abundance+, a homesteading education platform, now serves 7,700+ subscribers and earns over $1M annually, with 76% of viewing on apps. Discover how Abundance+ 2Xe’d revenue by introducing apps.
- Roku dominates TV app usage, accounting for 80% of total TV app watch time across Uscreen creators. (Uscreen, DEA)
- In the Media & Entertainment category, Roku accounts for 23% of all app viewership, showing strong consumer preference for large-screen content. (Uscreen)
- In Faith & Spirituality, more than 50% of all TV app watch time happens via Roku, proving its strength among faith-based creators (Uscreen)
Takeaway: App-enabled platforms are capturing more market share, proving that accessibility and cross-device experiences are essential for growth.
Device usage & app engagement statistics
Viewers expect seamless transitions between devices, and their behavior shows a preference for content that fits their mobile-first lives. App usage has surged, dramatically outpacing web consumption. This section uncovers how devices influence engagement depth and frequency.
- Apps made up just 40% of content consumption in early 2023. By late 2024, that number jumped to 59%, as users consumed 1.5bn minutes through mobile and TV apps—nearly twice as much as the 871m minutes on the web. (Uscreen)
- App watch time in the fitness industry rose by 12.96%, while web watch time dropped by 14.09%. (Uscreen)
- App watch time surged by a massive 89.15% in Yoga & Wellness, while web watch time declined by 11.41%. (Uscreen)
- Roku is our most commonly used TV app, representing 80% of all watch time from TV apps. (Uscreen)
- Users are also more willing to pay on mobile, and our customers see 16% of paid subscriptions purchased directly through apps. (Uscreen)
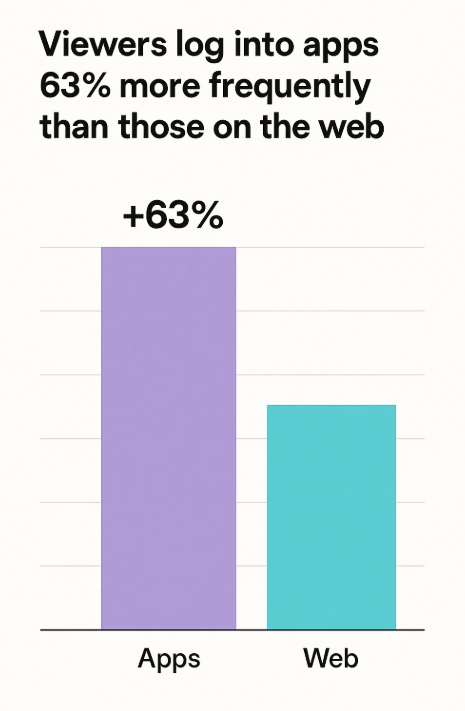
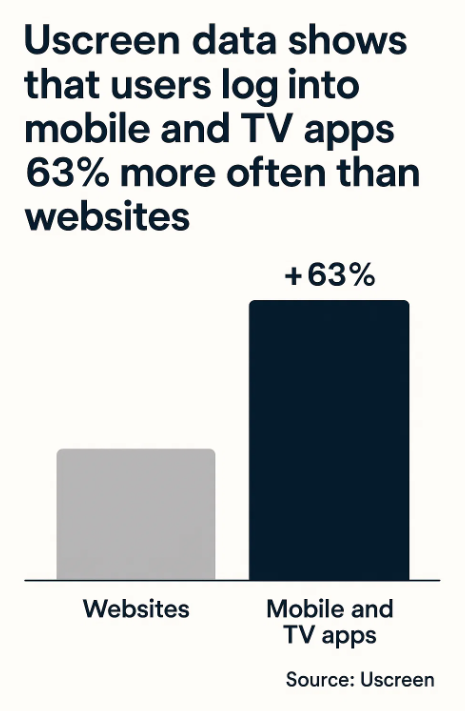
- Viewers log into apps 63% more frequently than those on the web. (Uscreen)
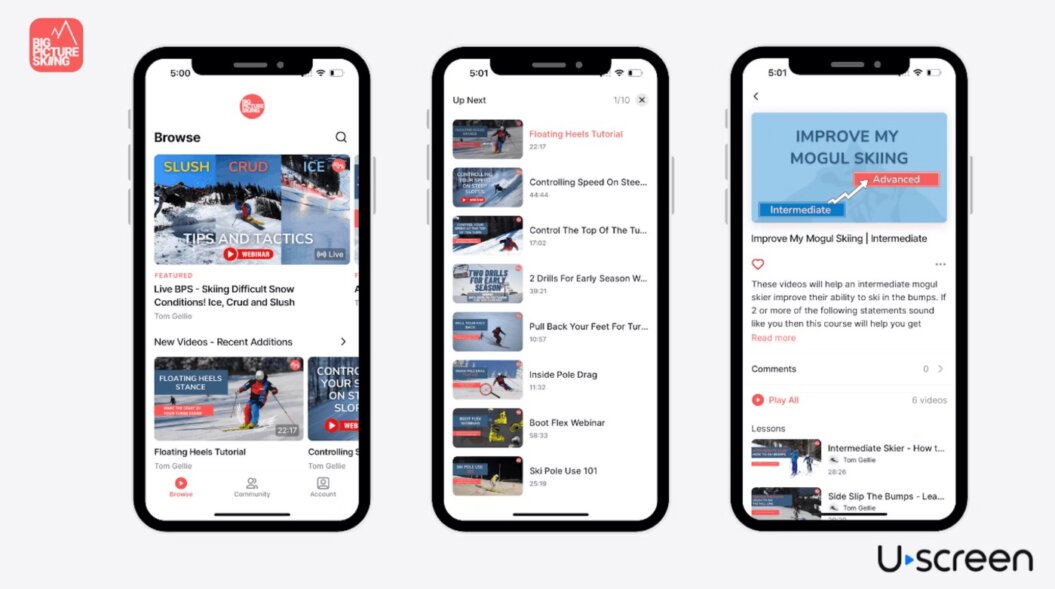
Creator Spotlight: How Big Picture Skiing earns $30,000 per month with Uscreen
Big Picture Skiing, a niche creator in the ski coaching space, earns $30,000 per month from 1,100 paying members, with 40% of whom consume content through the mobile app. Their success highlights how mobile access can power niche growth and consistent user engagement. Find out how they grew to $30,000 in monthly revenue.
Takeaway: Convenience drives consumption—apps create stickier, more engaging viewer experiences that outperform web-only models.
Consumer spending & subscription behavior
Rising subscription costs haven’t dampened consumer demand; instead, users are looking for flexible, device-friendly experiences. As habits evolve, so do expectations around pricing and value. These stats highlight the changing dynamics of subscription loyalty and behavior.
- 66% of Americans are open to ad-supported content if it means accessing platforms for free, reinforcing the viability of hybrid revenue models. (Statista)
- 44% of Disney+ subscribers reported they would cancel if prices increased further—demonstrating price sensitivity even among premium brand loyalists. (Forbes)
- 65% of video streaming now happens through mobile and TV apps rather than browsers, reflecting a clear user shift to more immersive, on-the-go experiences. (Uscreen)
- Smartphone ownership now exceeds 60% globally, making mobile access not just a perk but a necessity for scaling video businesses. (Bank My Cell)
- The average monthly spend on streaming services jumped from $48 in early 2023 to $61 in 2024. (Uscreen)
- The average person now maintains three active subscriptions—up from 2.4 the previous year. (Uscreen)
- Flexibility is critical: consumers gravitate toward platforms that allow them to watch across devices, with cross-platform users staying subscribed 43% longer than single-platform users. (Uscreen)
- Smart TVs’ highest penetration in the UK is among respondents aged 45-54 years old. (Statista)
Takeaway: User flexibility and cross-device compatibility are now critical to retaining subscribers and justifying increased monthly spend.
Subscription app vs web performance statistics: Engagement, retention & revenue
Performance data shows that apps outshine websites across key metrics like user engagement, retention, and spending. Audiences stay longer and watch more when apps are part of the equation. The statistics here deliver a compelling business case for app development.
- People spend 25% more time watching content on mobile apps. (Uscreen)
- 78% of community activity takes place on mobile. (Uscreen)
- Mobile apps contribute 15% less churn and 1.6x more annual subscriptions for our customers. (Uscreen)
- Consumer spending on subscription-based apps has surged, with a 35% rise on iOS and a 25% increase on Android. (Uscreen)
- Customers that offer apps sell 1.6x more annual subscriptions than customers who don’t
- Uscreen customers who offer mobile & TV apps have 15% more retention. (Uscreen)
- Average watch time for stores without apps is 14 minutes per view, this can increase to 17 minutes per view when offering apps. (Uscreen)
- Members spend an average of 102 minutes watching content on apps vs 82 minutes for stores without apps. (Uscreen)
- Customers who offer apps see 17% more logins. (Uscreen)
- Community engagement and mobile apps go hand-in-hand, with 78% of community activity coming from mobile apps. (Uscreen)
- Subscribers who use apps watch up to 25% more content than those who don’t download your app. (Uscreen)
- Uscreen data shows that users log into mobile and TV apps 63% more often than websites, and spend 78% more total time on the platform. (Uscreen)
- App users are 141% more engaged with community features than those using websites. (Uscreen)
- Members with multi-device access engage 25% longer and are 15% more likely to renew their subscriptions. (Uscreen)
- Users log in to mobile and TV apps 63% more often than they do on web, and they spend 78% more time on the platform overall. (Uscreen)
- Subscriptions with apps retain 23% more users after 12 months than those without. (Uscreen)
- Membership businesses that have their own branded OTT apps have generated 10x more subscription MRR than those without. (Uscreen)
Takeaway: Apps significantly amplify subscription business metrics, making them a foundational element of long-term growth.
Subscription retention, churn, and reactivation benchmarks
Retention is the engine of subscription success, and it hinges on platform accessibility and community engagement. The right tools, like mobile apps and member interaction features, reduce churn dramatically. The stats that follow demonstrate the mechanics of building loyalty.
- Mobile apps contribute 15% less churn and 1.6x more annual subscriptions for our customers, meaning members stay longer and engage more deeply. (Uscreen)
- Uscreen customers who offer mobile & TV apps have 15% more retention. (Uscreen)
- Uscreen customers with apps experience 15% less churn on a monthly basis, this can be attributed to having more members on annual subscriptions and increased accessibility to your platform allows members to more easily discover the value of your membership. (Uscreen)
- We also see that customers with an active community see 2x less churn than those who don’t. (Uscreen)
- Members with multi-device access engage 25% longer and are 15% more likely to renew their subscriptions. (Uscreen)
- Subscriptions with apps retain 23% more users after 12 months than those without. (Uscreen)
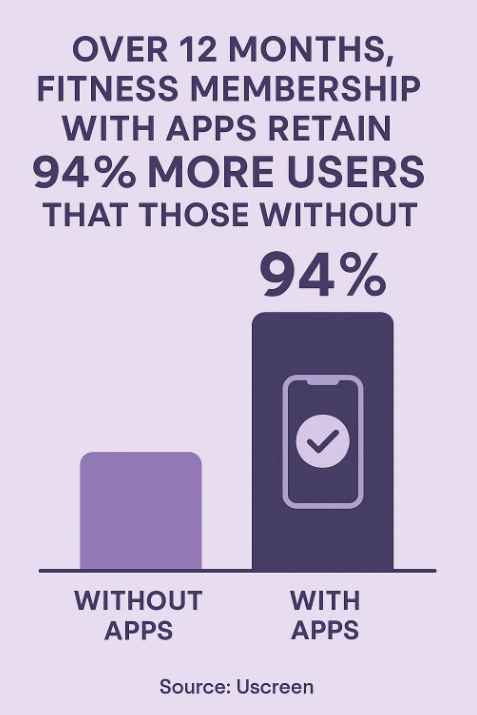
- Over 12 months, fitness membership with apps retain 94% more users than those without. (Uscreen)
- Having apps improves 12-month retention by 30% in the Yoga & Wellness space. (Uscreen)
- Apps drive a dramatic 285% increase in year-long retention for Media & Entertainment subscribers. (Uscreen)
- Offering apps boosts 12-month retention by 13% for faith-based content. (Uscreen)
- Subscriptions with apps see a 33% lift in retention over those without. (Uscreen)
- Cross-platform viewers maintain their subscriptions substantially longer, across all niches. (Uscreen)
- 99% of memberships report customers staying for longer than 3 months at a time.
- The average member stays subscribed for 12.3 months. (Membership Geeks)
Takeaway: Retention rates soar when subscribers can engage through apps and communities, showing that user experience fuels long-term value.
Subscription pricing & revenue insights
Monetization isn’t just about higher prices—it’s about giving users confidence in long-term value. Annual plans and higher ARPU correlate strongly with app-enabled experiences. Here, you’ll see how pricing models and user behavior intersect.
- The global ARPU for SVOD is projected to hit $78.97 in 2025, a clear sign that video platforms are becoming increasingly monetizable. (Statista)
- The OTT Video market is projected to reach US$443.29bn in revenue by 2029. (Statista)
- OTT Video market revenue in the United States is projected to reach US$146.25bn in 2025. (Stastista)
- The average revenue per user (ARPU) in the worldwide Subscription Video-on-Demand (SVOD) market is projected to amount to US$78.97 in 2025. (Statista)
- OTT Video Advertising represents the largest segment of the OTT market, which is expected to have a market volume of US$207.52bn in 2025. (Statista)
- Worldwide Video Streaming (SVOD) market revenue is projected to reach US$119.09bn in 2025. (Statista)
- In 2025, British consumers are set to spend £4.2bn on SVOD services, an increase over the £4.1bn expected to be spent on TV subscriptions. (Guardian)
- Fitness subscriptions with apps see 23% more annual plan purchases than those without. (Uscreen, AIR)
- Annual subscriptions rise 61% when apps are available in the Education & Coaching space. (Uscreen)
- 45.2% of established membership businesses bring in 6 figures each year. 6.9% bring in 7 figures. (Membership Geeks)
- 63.5% of membership businesses report their income increasing over the last year. (Membership Geeks)
- The average member lifetime value is $846.81. (Membership Geeks)
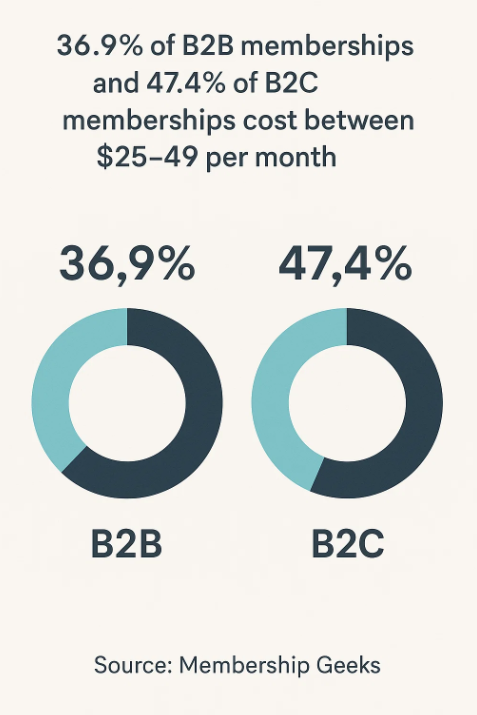
- 36.9% of B2B memberships and 47.4% of B2C memberships cost between $25-49 per month. (Membership Geeks)
Takeaway: Platforms that offer apps see better monetization and user commitment, underscoring the strategic value of app investment.
OTT advertising & AVOD trends
Ad-supported video on demand (AVOD) is rapidly gaining ground, especially as consumers look for low-cost streaming options. Hybrid models are proving an effective way to expand reach without sacrificing revenue. The stats shed light on how advertising is reshaping OTT monetization.
- AVOD user penetration is projected to rise to 52.8% in 2025, and later grow to 61% in 2029. (Statista)
- The largest market is OTT Video Advertising, which is expected to have a market volume of US$207.52bn in 2025. (Statista)
- Globally, OTT video advertising is projected to create US$207.22bn in 2025, with the potential to rise to US$267.98bn in 2029. (Statista)
- Worldwide, most free ad-supported streaming revenue will be generated in the United States, amounting to US$5.78bn in 2025. (Statista)
- 65% of OTT viewers who own a second screen will look up product information on the other screen whilst watching content on their main screen. (Video Advertising Bureau)
- 66% of Americans welcome watching advertisements in return for free OTT content. (Statista)
- The total number of AVOD service users will grow to US$4.9bn by 2029. (Statista)
- The average revenue per user (ARPU) for OTT video advertising is expected to hit US$12.18 in 2024. (Statista)
- The total digital video advertising spending in the US is expected to increase to US$112.77bn by 2028. (Statista)
- The average ad spending per internet user worldwide is projected to amount to US$50.27 in 2025. (Statista)
Takeaway: AVOD and hybrid models are unlocking new revenue streams, making OTT more accessible while preserving profitability.
Uscreen creator revenue & member behavior data
Real-world performance data from Uscreen creators highlights how apps and community tools drive revenue. This creator ecosystem shows what happens when engagement, accessibility, and platform strategy align. Expect clear proof that thoughtful tech investments pay off.
- Uscreen memberships with apps see 17% more logins, with more app usage, than customers who don’t offer apps. (Uscreen)
- Uscreen customers see 78% of community activity coming from mobile apps. (Uscreen)
- Uscreen customers with active communities see 2x less churn. (Uscreen)
- Average watch time for Uscreen memberships without apps is 14 minutes per individual viewer session, and can increase to 17 minutes when offering apps. (Uscreen)
- Uscreen memberships see their members spend an average of 102 minutes each week watching content on apps compared to 82 minutes for brands without apps. (Uscreen)
- Uscreen serves over 15m users, has launched 3,500 apps, and helped creators generate US$210m in annual earnings across various niches. (Uscreen)
Takeaway: Top-performing creators maximize revenue by pairing apps with community features, proving that platform strategy defines success.
General membership subscription site statistics
Membership models are growing in popularity across industries, driven by their recurring revenue and community potential. The majority of these businesses are relatively new but already showing strong results. These numbers reveal how creators are structuring for growth and retention.
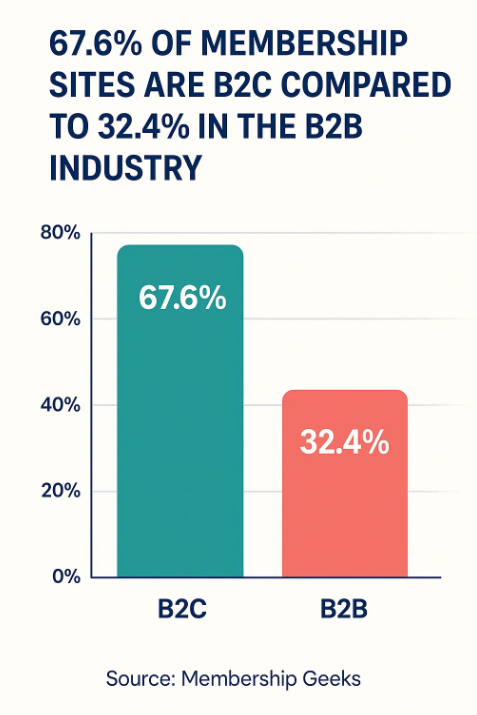
- 67.6% of membership sites are B2C compared to 32.4% in the B2B industry. (Membership Geeks)
- The top reason for wanting to start a membership site is to generate a stable, recurring revenue stream. (Membership Geeks)
- Membership websites are a relatively new strategy with the majority (66.8%) having been created within the last 3 years and just 9.3% being over 7 years old. (Membership Geeks)
- 88% of membership site owners report enjoying running their membership business. (Membership Geeks)
- 42% of established membership-based businesses have had over 1,000 people join over the lifetime of the business. (Membership Geeks)
- The most common type of membership site (22.8%) relates to business and entrepreneurship. Education comes in as a close second with 22.7%. (Membership Geeks)
- Member engagement and retention are reportedly the top concerns for membership sites. (GrowthZone)
- 76% of membership sites say email is the best way to re-engage members and generate renewals. (Marketing General)
- 67.3% of membership owners are unhappy with engagement levels within their community. (Membership Geeks)
- Content marketing (27.4%), email marketing (25.1%), and social media marketing (15.1%) are the most common marketing strategies used to bring in new members. (Membership Geeks)
- The average email conversion rate for membership sites is around 5.6%. (Membership Geeks)
Takeaway: Recurring models are thriving, and success is tightly linked to member engagement and content strategy.
Subscription membership site growth statistics
The difference in growth between app-enabled and web-only platforms is staggering. Apps clearly fuel higher engagement and more frequent usage. These growth benchmarks make a powerful case for investing in a multi-device experience.
- Subscriptions with apps grew 17% YoY in 2024, compared to only 3.6% for platforms without apps. (Uscreen)
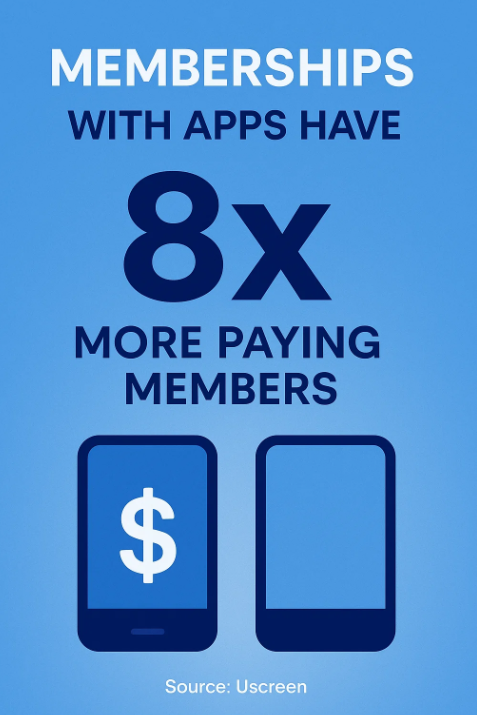
- Memberships with apps have 8x more paying members than those without apps. (Uscreen)
- Uscreen customers with apps have more 10x more daily and monthly active users compared to memberships without apps. (Uscreen)
- Memberships see 2x more watch time on their branded membership apps compared to their branded membership website. (Uscreen)
- Memberships that offer a dedicated community area see a much lower churn rate (6.06%) than those without (10.46%). (Membership Geeks)
- Members who are engaged in a membership’s community are 2x less likely to churn compared to non-engaged members. (Uscreen)
Takeaway: Apps are the catalyst for scale, driving exponential membership growth and deeper user engagement.
Subscription membership site financial statistics
The financial upside of subscription businesses increases dramatically with app adoption and strategic upselling. From average member value to long-term plan upgrades, revenue scales with accessibility. These stats outline the monetary advantages of a hybrid platform approach.
- Within the first 6 months of having an app, Uscreen customers see a 10% increase in user purchases, this can include purchasing a subscription plan, one-time payments, free trials, or joining a free plan. (Uscreen)
- In fact, Uscreen’s Upsell feature is used by our most successful stores, over 50% of our top 100 GMV earners use the upsell feature. (Uscreen)
- 90% of subscription upsells are created to move members from monthly plans to longer-term plans.
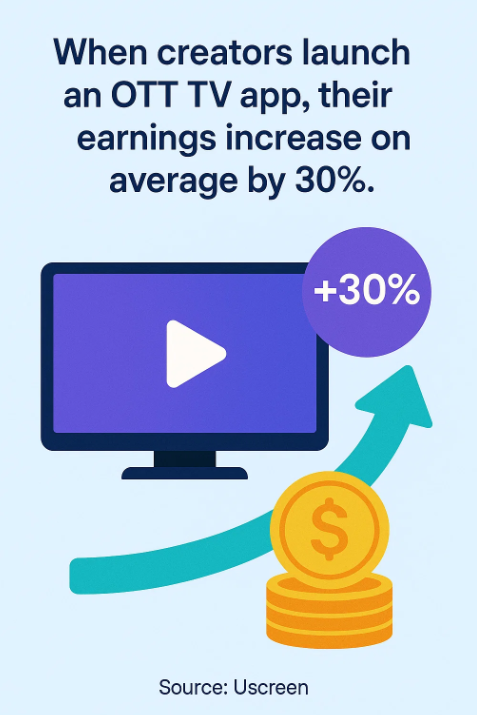
(Uscreen) - When creators launch an OTT TV app, their earnings increase on average by 30%. (Uscreen)
- OTT video subscription revenues will hit US$50.56bn this year, an increase of 12.5% YoY. Revenues will climb to US$64.12bn by the end of 2026. (Insider Intelligence)
- Fitness subscriptions with apps see 23% more annual plan purchases than those without. (Uscreen)
- Annual subscriptions are nearly 6x more common when Yoga & Wellness businesses offer apps — a 582% increase. (Uscreen)
- Entertainment platforms with apps see a 329% spike in annual subscriptions compared to those without. (Uscreen)
Takeaway: Apps unlock higher revenue per user, more upsells, and increased user lifetime value—clear markers of a high-performing model.
Subscription membership site business model statistics
The structure of your subscription business—how users join, what options they have, and how content is delivered—can make or break success. Data shows that onboarding, flexibility, and community all influence key performance indicators. Expect insights into what operational features drive results.
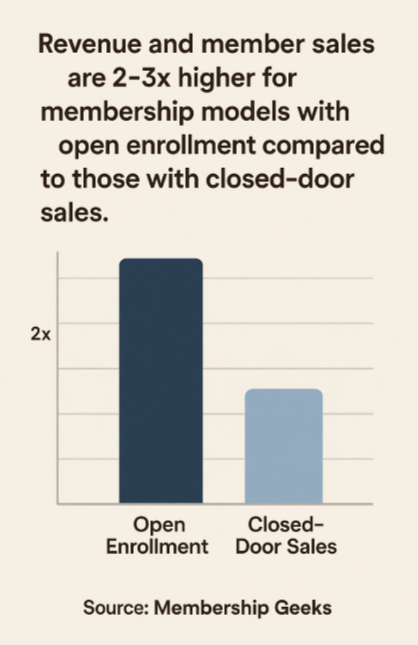
- Revenue and member sales are 2-3x higher for membership models with open enrollment compared to those with closed-door sales. (Membership Geeks)
- Only 35.9% of membership sites allow members to pause their subscription. (Membership Geeks)
- Just 32% of membership businesses offer different tiers to their membership. Some of the more popular differences between membership levels are different features/content, access to group coaching, or an exclusive high-tier community section. (Membership Geeks)
- 53.28% of membership sites are hosted using a membership plugin (like MemberPress or WooCommerce) on WordPress. (Membership Geeks)
- 20.84% of membership sites use a membership site platform (like Uscreen, Kajabi, or Wild Apricot ). (Membership Geeks)
- Just 32.4% of membership sites offer a free trial, with the most common trial length coming in at 7 days. (Membership Geeks)
- Memberships that offer a comprehensive onboarding process tend to see a lower churn rate. (Membership Geeks)
- Many companies use an LMS, or learning management system, to house learning content. The global LMS market size was valued at $16.19bn in 2022, and is expected to grow from $18.26bn in 2023 to $47.47bn by 2030. (Fortune Business Insights)
Takeaway: Operational choices like tiering, onboarding, and trial options significantly impact retention and revenue, especially when integrated with app-based access.
The future of video subscriptions & monetization
As technology evolves, so do the strategies creators need to stay competitive. We asked membership and subscription experts for insights on trends shaping the future of video. Here’s what they had to say about everything from AI personalization to community-first content.
On AI and creator business reach:

We’re seeing AI localization drastically improve global reach for creators, breaking down language barriers and expanding access to new audiences.
How community will influence creator-led businesses:

The next wave of creators isn’t just about content—it’s about connection. Community-first models are the new standard.
How personalization, mobile-first business models, and AI will work:

The future of OTT is mobile-first, interactive, and powered by owned communities. AI will personalize viewer experiences and streamline content delivery.
Takeaway: It’s clear that emerging trends point to hybrid monetization, global distribution, and smarter automation as key pillars for future-ready subscription businesses. The subscription landscape is evolving fast, and creators who lean into mobile, AI, and community will be the ones who thrive.
There’s a bright future for subscription services
In 2025, those with the right tools and strategies are seeing stronger engagement, lower churn, and higher revenue. Whether you’re running a fitness brand, a media channel, or an education platform, features like mobile apps, onboarding flows, and community tools are now essential.
Hybrid web and app models are outperforming web-only setups. The data shows that creators who focus on flexibility, access, and member experience are growing faster and earning more. Use the insights in this report to plan your next move.