
The OTT market is made up of several services. As a video OTT platform provider, Uscreen collects and maintains this list of OTT statistics related to live streaming and on-demand video. Alone, each section shows a snapshot of the industry. Together, these statistics offer a unique perspective on how the OTT landscape is shifting.
This resource is filled with revenue figures and growth projections. It also includes a glimpse at how streaming platforms are influencing the industry, what consumer behavior tells us about content consumption and preferences, and more.
Top 10 OTT Statistics for 2025 and Beyond
Revenue from the OTT industry continues to grow, and it’s expected to reach US$443.29bn in 2029. Much of this growth is spurred on by high viewer consumption, an increase in advertising opportunities, and OTT apps providing more convenient access for viewers.
Here are the top 10 OTT statistics that prove how much the OTT industry has grown when it comes to revenue:
- With 21 hours of content consumed per week, Americans spend the equivalent of a part-time job streaming digital media in 2024. (Forbes)
- Revenue in the OTT Video market is projected to reach US$443.29bn by 2029. (Statista)
- When streaming video, 65% of the time it’s done on mobile and TV apps rather than on browsers. (Uscreen)
- Revenue in the OTT Video market in the United States is projected to reach US$146.25bn in 2025. (Statista)
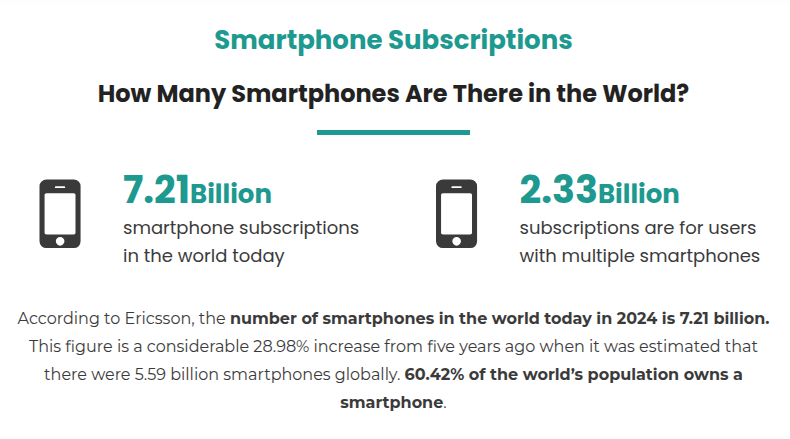
- Globally, there are 7.21 billion smartphones capable of running apps, with 60.42% of the world’s population owning one. (Bank My Cell)
- The average revenue per user (ARPU) in the Video Streaming (SVOD) market worldwide is projected to amount to US$78.97 in 2025. (Statista)
- AVOD user penetration is forecast to be 52.8% in 2025, growing to 61% in 2029. (Statista)
- In 2024, apps made up 59% of OTT content consumption, rising from just 40% the year before. Audiences watched 1.5 billion minutes on mobile and TV apps, nearly double the 871 million minutes on web platforms. (Uscreen)
- TV app users attend 154% more live stream events than web users, and 105% more than mobile users. Mobile app users also attend 24% more events than website viewers. (Uscreen)
- When creators launch an OTT TV app, their earnings increase on average by 30%. (Uscreen)
OTT Market and Revenue Statistics
OTT market share is on the rise on the back of advertising growth and higher ARPU figures. As more US consumers opt for OTT streaming services, traditional TV channels are taking a significant knock. US cable companies have lost over a third of their client base since 2010.
- The global OTT video market size is expected to top US$476 billion by 2027. That’s compared to $238 billion in 2021. Today, the U.S. accounts for about 46% of that global market size. (Global Logic)
- Revenue is expected to show an annual growth rate (CAGR 2024-2029) of 6.30%, resulting in a projected market volume of US$429.40bn by 2029. (Statista)
- The largest market is OTT Video Advertising, which is expected to have a market volume of US$207.52bn in 2025. (Statista)
- In the OTT Video market, the number of users is expected to amount to US$4.9bn by 2029. (Statista)
- User penetration in this market is expected to be 52.8% in 2025, increasing to 61.0% by 2029. (Statista)
- The average revenue per user (ARPU) in the OTT Video market is projected to be US$83.28 in 2025. (Statista)
- The average revenue per user (ARPU) in the Video Streaming (SVOD) market worldwide is projected to amount to US$78.97 in 2025. (Statista)
- Revenue in the Video Streaming (SVOD) market worldwide is projected to reach US$119.09bn in 2025. (Statista)
- 99% of US consumers have at least one video streaming subscription, with 2.9 subscriptions being the average. (Forbes)
- By 2029, Latin America will have 165 million subscribers to OTT streaming platforms. (Statista)
- Projections indicate that the number of OTT video users in India will reach a staggering 4,216.3 million by 2027, with a user penetration rate of 53.0%. (Times of India)
- The market size of the Transactional Video on Demand (TVOD) market is projected to reach over US$13bn by 2028, with an annual growth rate of about 9%. (Statista)
- Revenue in the Free ad-supported streaming TV (FAST) market worldwide is projected to reach US$11.68bn in 2025. (Statista)
- US connected TV (CTV) ad spend will continue to grow through 2027, when it will reach US$40.90 billion. (Insider Intelligence)
- OTT video subscription revenues will hit US$50.56 billion this year, an increase of 12.5% YoY. Revenues will climb to US$64.12 billion by the end of 2026. (Insider Intelligence)
- Subscriptions with apps grew 17% YoY in 2024, compared to only 3.6% for platforms without apps. This 121% growth advantage clearly shows how apps drive subscriber acquisition. (Uscreen)
- In 2025, British consumers are forecast to spend £4.2bn on SVOD services, that’s higher than the £4.1bn set to be spent on TV subscriptions. (Guardian)
- In the US, the number of Connected TV viewers will grow from 111 million in 2022 to 121 million by 2027. (Statista)
- US Cable TV subscriptions have dropped by 34.57% since 2010. (Evoca TV)
OTT Platform and App Statistics
Streaming media onto phones and TV through apps continues to expand in both expected and unexpected ways. Today, we’re seeing a push towards convenience.
Viewers want to be able to choose where and how they stream, and this can be on TVs, desktops and laptops, tablets, or smartphones. Smart creators are investing in OTT apps, which are available across several platforms to offer viewers the most frictionless way to enjoy content.
- When streaming video, 65% of the time it’s done on mobile and TV apps, rather than on browsers. (Uscreen)
- At 81.44 million users, the most popular OTT TV app in North America as of 2025 is Netflix, with a 21% share of the SVOD market in the United States. (DemandSage)
- In 2024, apps made up 59% of OTT content consumption, rising from just 40% the year before. Audiences watched 1.5 billion minutes on mobile and TV apps, nearly double the 871 million minutes on web platforms. (Uscreen)
- Uscreen data shows that users log into mobile and TV apps 63% more often than websites, and spend 78% more total time on the platform. This makes apps the most engaged touchpoint in the OTT ecosystem. (Uscreen)
- The most successful OTT platforms today provide cross-device flexibility. Viewers who use both apps and web versions stay subscribed up to 43% longer than those who use one or the other. (Uscreen)
- OTT platforms with app access see 121% more annual plan purchases. Apps give users the confidence and convenience to commit long-term, especially for fitness, entertainment, and education categories. (Uscreen)
- App users are 141% more engaged with community features than those using websites — likely thanks to the convenience of on-the-go access and real-time push notifications. But the most engaged members by far are those who use both web and apps, with community participation 220% higher than web-only users.
When viewers can connect anytime, anywhere, community stops being a feature — and becomes a habit. (Uscreen) - TV app users attend 154% more live stream events than web users, and 105% more than mobile users. Mobile app users also attend 24% more events than those using websites. This shows that when viewers can tune in from a bigger screen — or on the go — they’re far more likely to show up live. (Uscreen)
OTT Advertising Statistics
Ad spend and ad revenue across OTT video have skyrocketed, and the data tells us that it’s only going to get bigger. OTT streaming allows platforms to gather more user data, track behavior statistics, which offers better product placement and audience matching capabilities.
As average spending per internet user increases in 2025, we expect to see OTT advertising become a larger driving factor for OTT streaming market growth.
- Global OTT video advertising is set to generate US$207.22bn in 2025, growing to US$267.98bn in 2029. (Statista)
- Globally, most free ad-supported streaming revenue will be generated in the United States, amounting to US$5.78bn in 2025. (Statista)
- When OTT viewers own a second screen, 65% of them will look up product information on the other screen whilst watching content on their main screen. (Video Advertising Bureau)
- In general, 66% of Americans are okay with watching advertisements in return for free OTT content. (Statista)
- The total number of AVOD service users will grow to US$4.9bn by 2029. (Statista)
- AVoD user penetration is forecast to be 52.8% in 2025, growing to 61% in 2029. (Statista)
- The average revenue per user (ARPU) for OTT video advertising is expected to hit US$12.18 in 2024. (Statista)
- The total digital video advertising spending in the US is expected to increase to US$112.77 billion by 2028. (Statista)
- The average ad spending per internet user worldwide is projected to amount to US$50.27 in 2025. (Statista)
OTT Streaming Services Statistics
Consumers are spending more on OTT streaming services overall, with the average American subscribing to more than two streaming platforms. While niche platforms are on the rise (see our OTT Trends section), titans like Netflix continue to dominate globally.
But competition in this industry is tough. It’s hard to retain subscribers, especially when there is less exclusive and new content. Here are some statistics about how OTT viewers use different services.
- One recent survey shows that almost all US households, 99% to be precise, subscribed to at least one OTT streaming media app, in 2024. (Forbes)
- On average, Americans pay for 2.9 streaming subscriptions every month, a sign of things to come as people hop between services to get the content they want. (Forbes)
- Netflix is the biggest OTT service in the US and Canada in terms of market share and revenue, with 31% of all subscription revenues heading their way. (Forbes)
- With more than 260.28 million subscribers, Netflix is the most popular streaming service worldwide in 2024. Amazon ranked second with 200 million subscribers. (Forbes)
- 44% of streaming users indicated that Disney+ would be the first service they would drop if subscription prices increased. Disney+ is followed by Hulu and ESPN+, at 40% and 35% users, respectively. (Forbes)
The Rise of Creator OTT Streaming
As more creators expand their brands, a switch from typical ad-supported streaming platforms, like YouTube, to subscription platforms like Uscreen is happening.
Uccreen serves over 15m users, has launched 3500 apps, and helped creators generate US$210m in annual earnings across various niches.
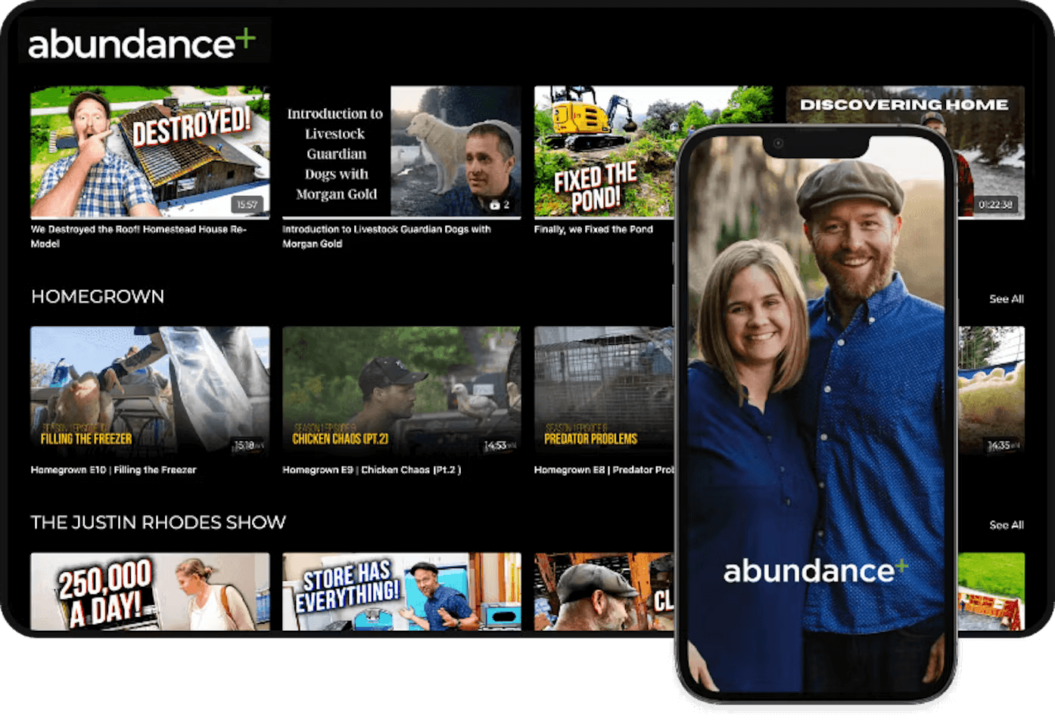
Abundance+, a homesteading community founded by Justin Rhodes, is filled with education, resources, and expert guidance on becoming self-sustainable, launched 6 mobile & TV apps. Today, they have over 7,700 paying subscribers and earn over 1M in annual revenue, with over 76% of viewership coming from their OTT apps.
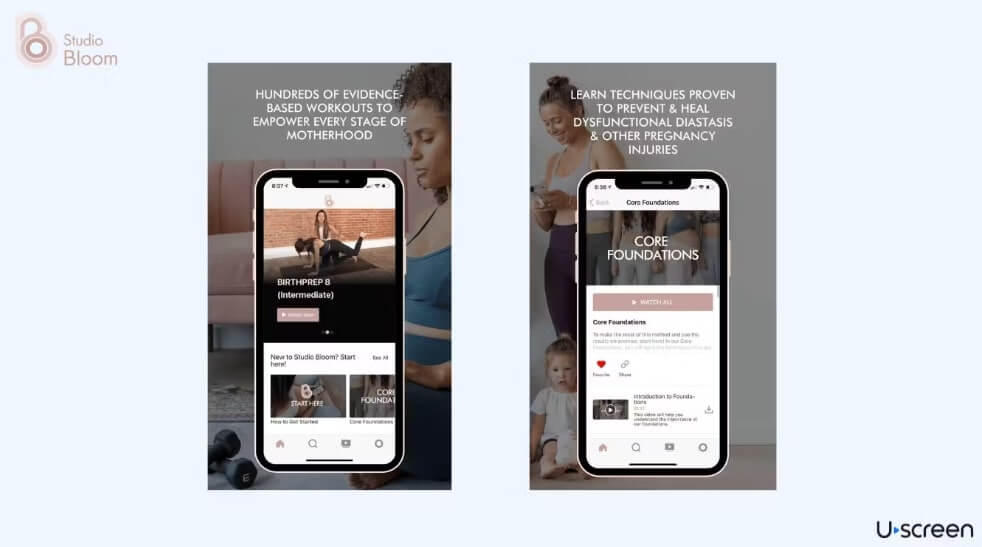
Brooke Cates, a certified personal trainer specializing in pre- and postnatal care, founded Studio Bloom. It’s an online community with fitness programs for women during pregnancy and after birth.
Brooke launched 6 mobile & TV apps with Uscreen, quickly growing her membership base to over 5,000 paying subscribers and earning over US$1M in annual revenue. She sees over 76% of member watch time come from OTT apps.
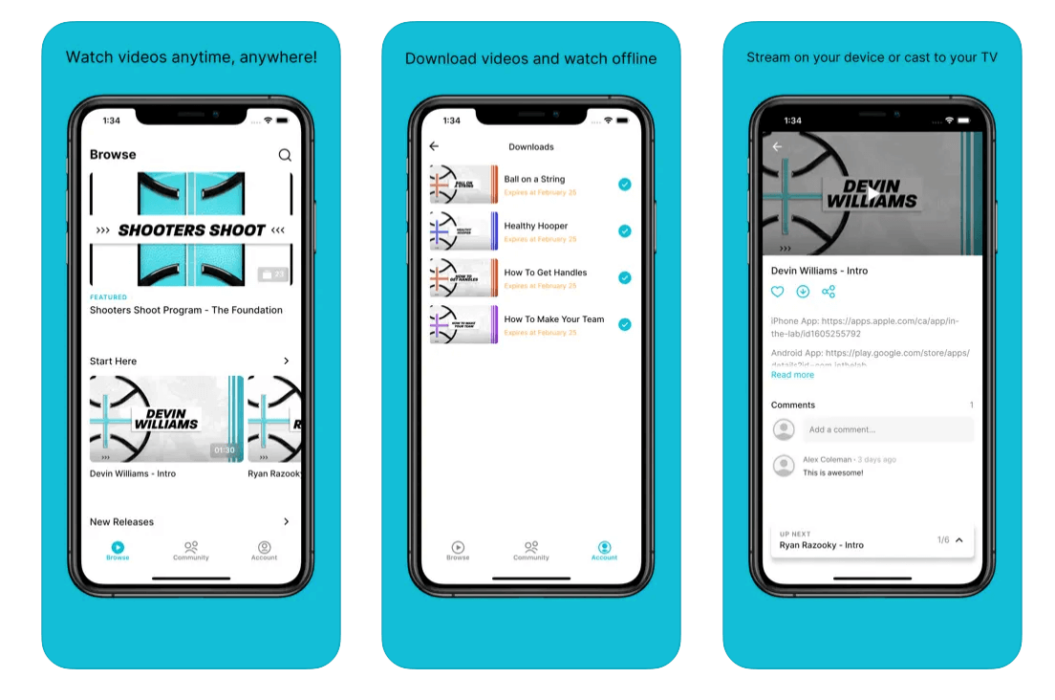
In the Lab+ is a global basketball brand founded by Navin Ramharak and Devin Williams. It’s dedicated to providing athletes with everything they need, from professional training programs and coaching to an extensive line of branded apparel.
Launching 2 mobile apps doubled their overall viewership within a year, with 79% of their views coming from OTT apps.
OTT Live Streaming Statistics
OTT live streaming has become a huge business. Stats across industries show fascinating viewer patterns, indicating that consumption differs by niche. Internal data shows the following user viewership trends during a typical week:
- TV app users attend 154% more live stream events than web users, and 105% more than mobile users. Mobile app users also attend 24% more events than website viewers. (Uscreen)
- Fitness live stream viewer engagement peaks early in the week. Mondays and Tuesdays see ~9.5% more users than average, while Sunday dips nearly 9%. This pattern is likely driven by the momentum of “new week” goals to drive consistency.
- Yoga engagement builds gradually — Tuesday is the highest day (6.5% above average), while Sunday sees a slight dip. This slow rise suggests that yoga is often used as a midweek stress reliever and weekend wind-down, rather than a start-of-week routine.
- Engagement remains steady throughout the week, with only mild variation — Monday through Friday sit about 1–2% above average. Entertainment content is clearly part of users’ everyday habits, not strongly tied to weekday rhythms.
- Faith-based viewing is most active midweek, with Tuesday showing 4.4% above average. Sunday is slightly below average. This suggests audiences turn to spiritual content more for weekday grounding than weekend rituals.
- Viewer activity is strongest Tuesday–Thursday, peaking 5.3% above average on Tuesday and falling off sharply on Sunday (–8%). Structured learning is clearly a weekday priority, tapering off as users head into the weekend.
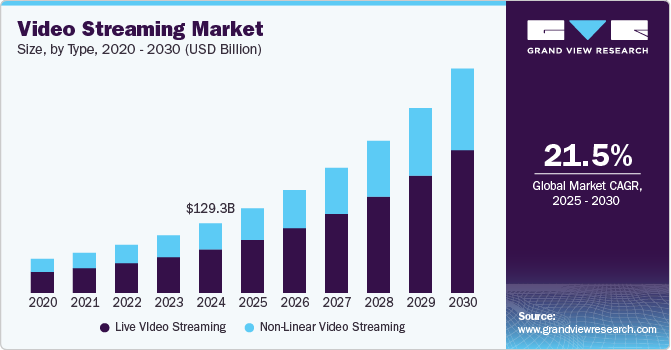
- Live video streaming is expected to have a revenue of US$184.27 billion by 2027. (Grand View Research)
- The live streaming market is expected to grow to US$3.21 billion in 2027 at a CAGR of 21.2%. (Research and Markets)
- During the third quarter of 2024, live streaming recorded an audience reach of almost 28.4% across global internet users. (Statista)
- Subscribers who use apps watch up to 25% more content than those who don’t download your app. (Uscreen)
OTT Device Usage Statistics
With so many devices available to audiences, it’s clear there are some complex patterns in how they are used. From mobile to TV streaming devices, here’s a look at various market share figures:
- Globally, there are 7.21 billion smartphones capable of running apps, with 60.42% of the world’s population owning one. (Bank My Cell)
- The most popular mobile operating system across all markets is Android with a 71.8% share of the market, with iOS on 27.62%. (GlobalStats StatCounter)
- In the US, while Apple has a much larger mobile market, with iOS earning 56.13%, it lost just over 2%, while Android grew from 41.39% to 43.59%. (GlobalStats StatCounter)
- In the South American smartphone market, iOS owns 14.48% of the market compared to Android’s 85.3%. (GlobalStats StatCounter)
- Smart TVs’ highest penetration in the UK is among respondents aged 45-54 years old. (Statista)
- 98% of people aged 16-24 in the UK own a smartphone, compared to 86% of those aged 55-64. (Uswitch)
- Across categories, iOS dominates OTT consumption with 58% of all app usage, followed by Android (24%) and Roku (10%). This mobile-first behavior indicates how crucial it is to offer flexible device access. (Uscreen)
Consumer Behavior Statistics
How your audience accesses your content is vital to developing your content production and, by extension, your business. App usage has grown considerably, but this isn’t just on smartphones.
We’re seeing that when subscribers aren’t restricted to a single device, they engage more and stick around for longer. This pattern shows that content fits into their daily lives, not the other way around. And when content is easy to access, it becomes a habit.
We’re also seeing more logins, longer watch times, and more community participation. Flexibility is proving to be more than a perk. It’s the secret to lasting engagement.
- With 21 hours of content consumed per week, Americans spend the equivalent of a part-time job streaming digital media in 2024. (Forbes)
- Around 245.3 million people (72.2% of the population) in the US will watch OTT video services at least once per month. That’s over 72% of the population. (Insider Intelligence)
- The global penetration rate in the ‘OTT Video’ segment of the media market is set to reach a new peak of 70.1% by 2029. (Statista)
- According to Netflix, half of its subscribers access content on a mobile device each month. (Independent)
- Uscreen memberships with apps see 17% more logins, with more app usage, than customers who don’t offer apps. (Uscreen)
- Uscreen customers see 78% of community activity coming from mobile apps. (Uscreen)
- Uscreen customers with active communities see 2x less churn. (Uscreen)
- Average watch time for Uscreen memberships without apps is 14 minutes per individual viewer session, and can increase to 17 minutes when offering apps. (Uscreen)
- Uscreen memberships see their members spend an average of 102 minutes each week watching content on apps compared to 82 minutes for brands without apps. (Uscreen)
- In early 2023, apps made up just 40% of content consumption. By late 2024, that number jumped to 59%, as users consumed 1.5 billion minutes through mobile and TV apps—nearly twice as much as the 871 million minutes on websites. Apps are quickly becoming the primary way audiences engage with content. Why? Flexible, on-the-go viewing fits better into daily life. (Uscreen)
- Viewer activity peaks on Mondays and Tuesdays — each with ~4.7% more users than average — and tapers off toward the weekend, dropping ~5% by Sunday. This suggests that audiences are most engaged early in the week, likely using content to kickstart routines or ease into productivity. (Uscreen)
OTT Trends
Several factors drive trends, and for the OTT industry, customer engagement, market growth, and technology innovations are powerful accelerators. Our list of 10 video creator trends to watch includes these accelerants and the unique impact and opportunities they bring.
1. AI-Powered Personalization
OTT platforms are increasingly leveraging artificial intelligence to deliver personalized content recommendations. By analyzing user behavior and preferences, AI enhances viewer engagement and satisfaction.
Netflix has shared that it uses AI to analyze user viewing habits and preferences to serve up personalized content suggestions. Its AI also selects the most appealing thumbnails for each user based on their viewing history.
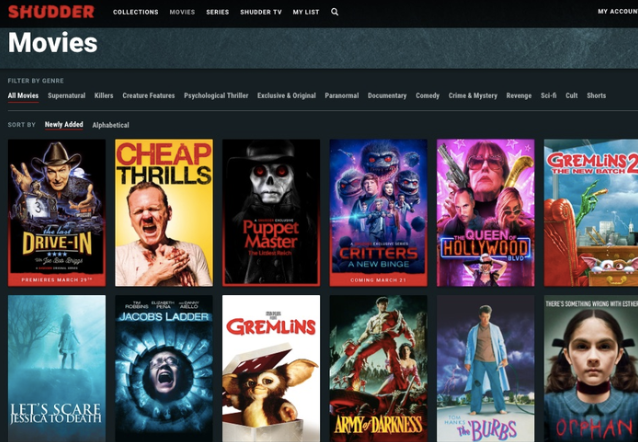
2. Niche OTT Platforms Are Growing
Targeting specific audiences by genres, languages, or interests is giving way to a new market. Shudder is an example of a horror film streaming service. These platforms provide tailored content, catering to dedicated viewer segments.
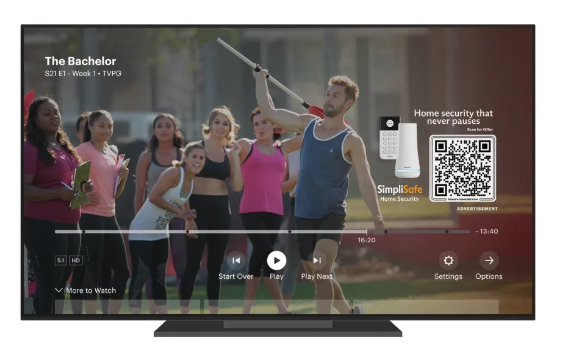
3. OTT Ad Optimization is Growing
OTT advertising is evolving, giving room to smarter ad models that aim to ease customer experiences and avoid ad fatigue. Disney’s “Pause Ad” format serves up ads when viewers pause a show, offering subtle branded images that don’t disrupt the viewing experience.
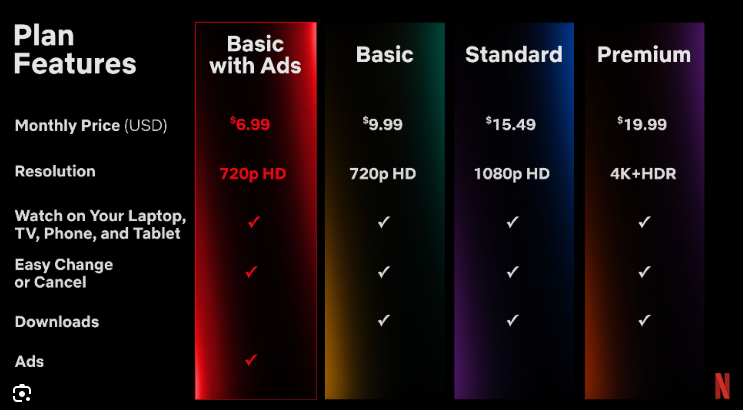
4. New Hybrid Streaming Models
Hybrid models combining subscription-based (SVOD) and ad-supported (AVOD) services are gaining traction. This approach offers flexibility to consumers and diversified revenue streams for providers. Large platforms, from Netflix to Roku, all offer ad plans.
5. Traditional TV Channels are Making the Move to OTT
Traditional TV channels and pay-TV services are shifting to OTT platforms. This migration reflects changing consumer preferences for on-demand and internet-based content delivery. CBS rebranded to Paramount+, HBO is now known as Max, NBC introduced Peacock, ABC and Disney run Disney+ and Hulu, and BBC has introduced BBC iPlayer.
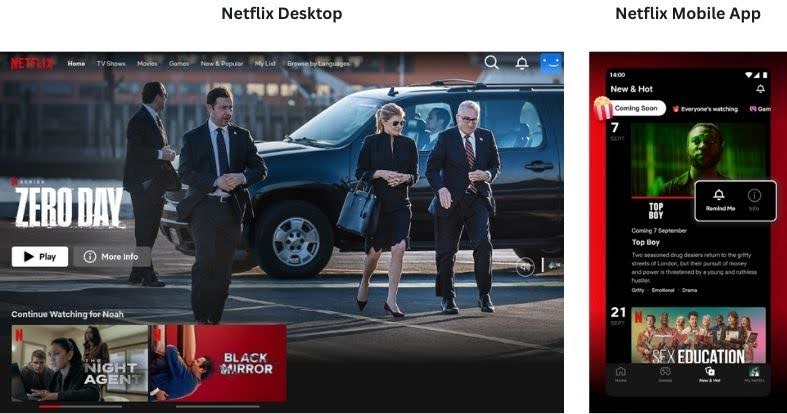
6. The Race to Deliver the Best User Experiences
OTT services are prioritizing user experience. Platforms are focusing on improving interface design, reducing buffering times, and offering seamless navigation across devices. A superior user experience is key to retaining subscribers.
7. Streaming Quality is Improving
As high-resolution displays become more affordable, OTT platforms are adopting 4K and 8K streaming capabilities. This advancement ensures sharper and more immersive viewing experiences.
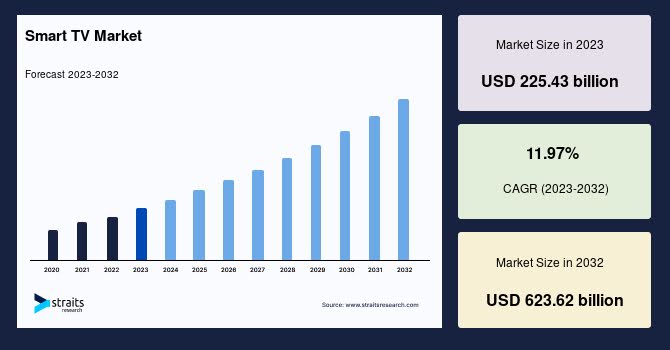
8. Smart TVs are Becoming More Popular Viewing Devices
Smart TVs are becoming the primary medium for OTT content consumption. Their integration of streaming apps and internet connectivity offers convenience and accessibility to users. Straits Research found that the smart TV global market grew in value from US$225.43bn in 2023 to US$252.41bn in 2024, with a forecast growth of US$623.62bn in 2032.
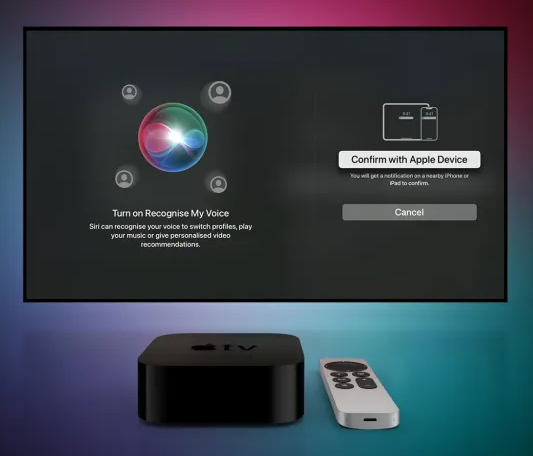
9. Integration of Voice Control
Voice-controlled navigation is making its way into OTT platforms. While mostly present on smart TVs, it offers users the chance to search and control playback using voice commands. This feature also enhances accessibility and user convenience.
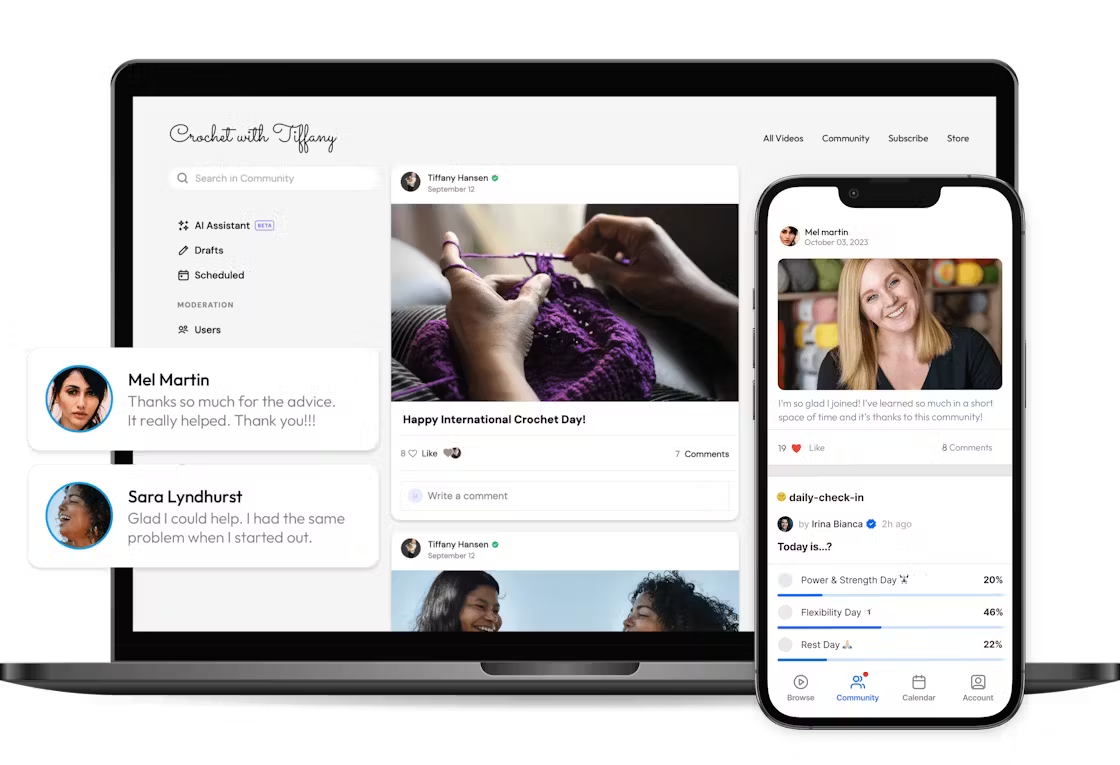
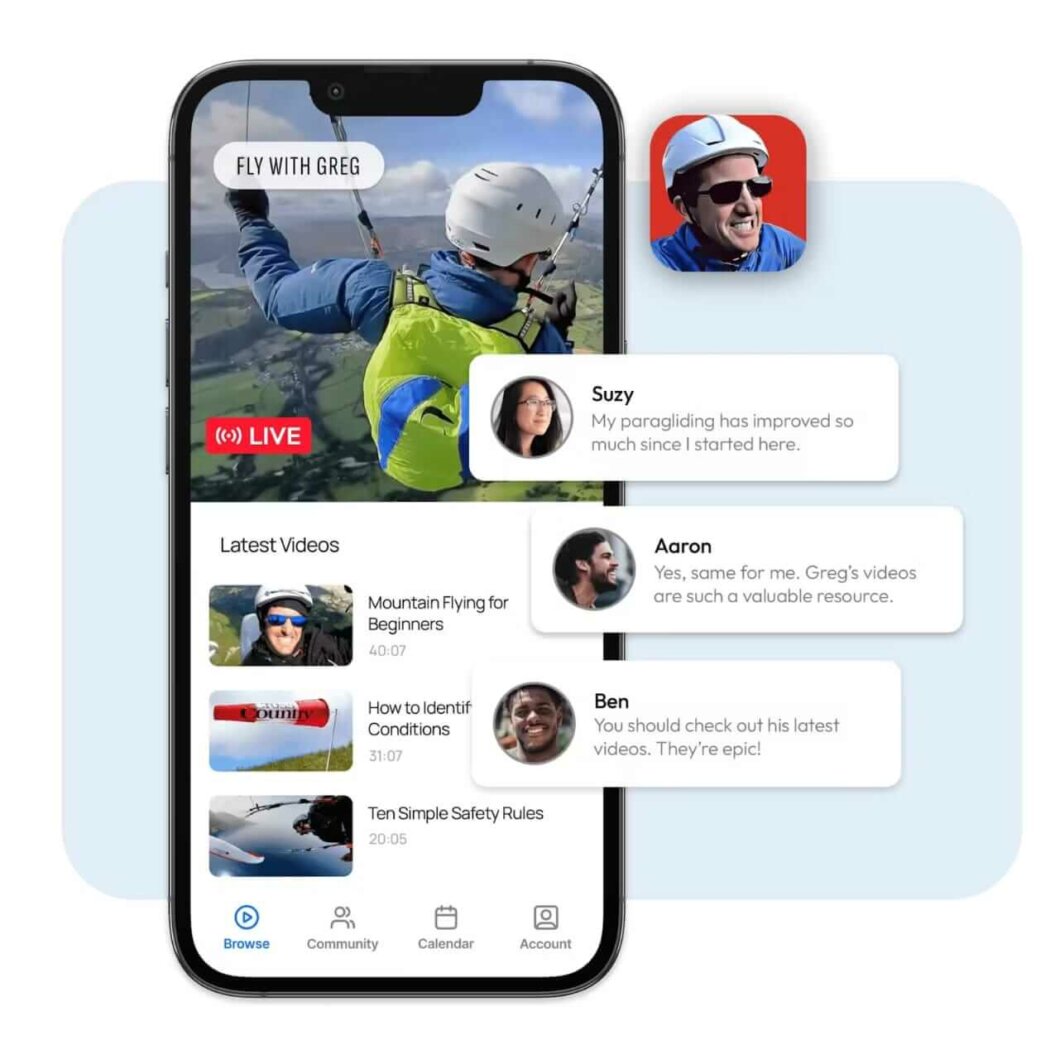
10. Interactive Content and Social Features
Interactive storytelling and social engagement features, such as live chats and co-viewing experiences, are enriching OTT content. These elements foster community building and deeper viewer involvement.
Uscreen offers real-time chat to engage viewers during live streams.
Conclusion
The OTT industry is growing, thriving, and there are several elements worth paying close attention to. OTT streaming platforms’ growth in the US and abroad will accelerate, and to make market share easier to capture, platforms will be capitalizing on extending reach across devices.
We expect to see a ramp-up in content variety and more competitive pricing plans to reach broader audiences. As more creators choose to build linear and more predictable income streams, creator-based OTT platforms will expand, too.
While many factors contribute to the OTT industry’s meteoric growth, one thing is certain: consumers will have more options for entertainment than ever before.
OTT Statistics FAQ
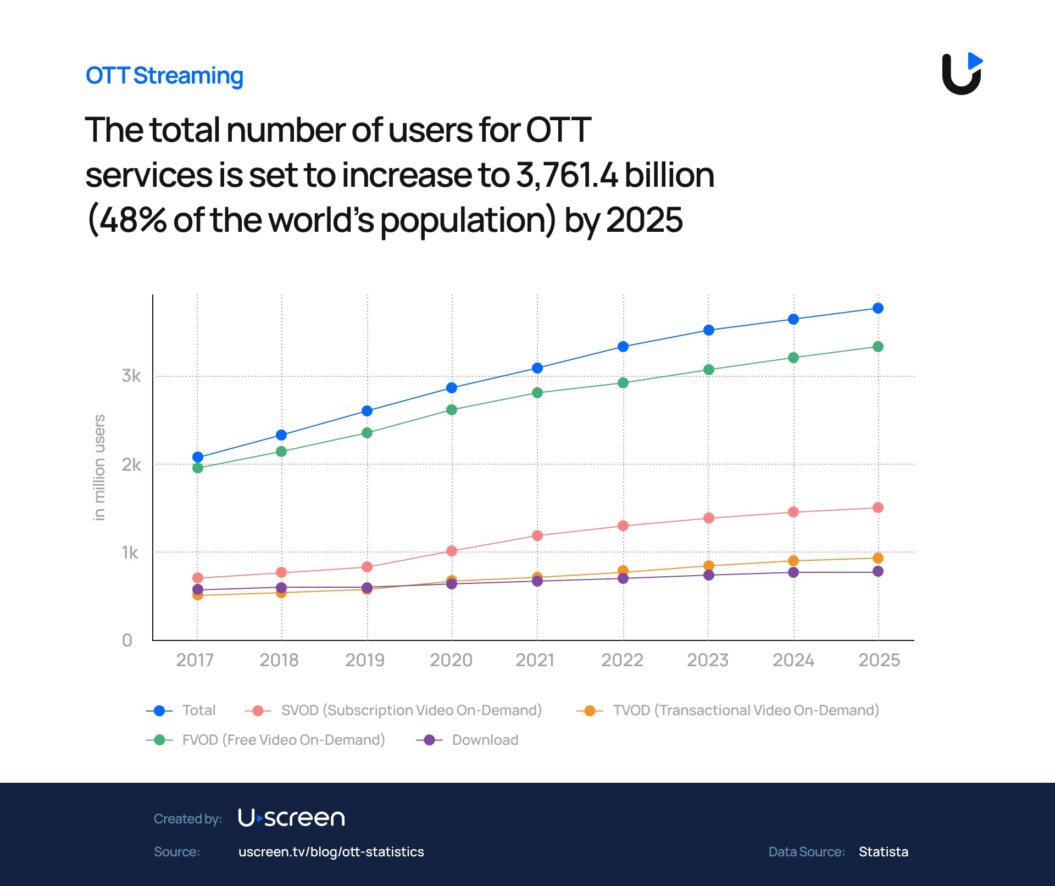
The global OTT video market size is US$343.82bn in 2025 and is expected to top US$443.29bn by 2029.
Yes. Forecasts show that AVOD user penetration is forecast to be 52.8% in 2025, growing to 61% in 2029. (Statista). The average revenue per user (ARPU) in the Video Streaming (SVOD) market worldwide is projected to amount to US$78.97 in 2025. Revenue in the Video Streaming (SVOD) market worldwide is projected to reach US$119.09bn in 2025.
The United States OTT Video market is projected to reach US$146.25bn in 2025.
With OTT (Over-the-Top) services, you can watch films and TV on demand on any device, thanks to the internet. These platforms often offer cost-effective, personalized viewing experiences with vast content libraries and global accessibility. The OTT providers also have advanced analytics, multiple monetization models, and the goal of keeping content fresh.